Equities

A bit of Monday pondering…

A little something to think about on your Monday morning.

S&P 500 – US Equities.

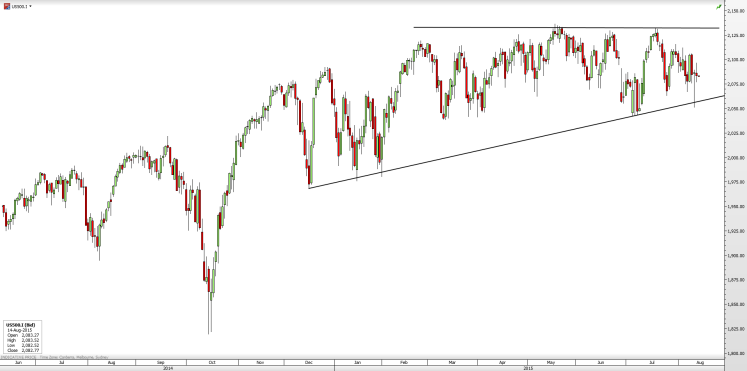
Ascending triangles (in the chart below) are generally a bullish formation where the instrument could break through the horizontal line, to the topside.

Food for thought; Could the S&P 500 look to trade in this range for a month or so to come, before it is announced that interest rates will be left as they are? This would be a positive for equity markets and could see us break through to the upside. It’s funny how at times, a macro event can confirm a technical pattern… Possible? Let’s see.

sp500


LP

May Take On It All – August

ScreenShot122

It’s been a while since I have updated everyone on everything from this side of the desk and we seem to be as settled in the new office as we possibly can be given everything the market has thrown at us this year. Given the amount of time that has passed since I last updated everyone, I thought I would provide my view on the current state of play along with outlining some of the things we have been doing and what is currently in play along with some ideas going forward.

With the issues in Greece dominating the early part of the northern hemisphere summer it now seems to have stopped making the headlines of every media outlet available.  This has seen the Euro trade in a range between 1.0500 to 1.1500 against the USD.  European equity markets took the news badly on any negative news but were also very quick to rebound on any sign of an agreement or turnaround in the market. The sell offs provided good buying opportunities and we did so by purchasing some DAX calls through issued trade alerts. All trades that have been recently executed can be seen in the Performance Report that can be downloaded through the Performance Page.

Post Greece, the market then shifted its focus to China and the Federal Reserve in the US. The swings on a daily basis on the Chinese equity markets were significant to say the least but this was to be expected given the massive run up we had seen – 69.84% gain from the lows made in February this year alone!

In the US all eyes are on the September FOMC meeting in anticipation of a possible rise in interest rates. We have seen the USD strengthen against most currencies, combined with commodity prices, QE in Japan and Europe all pointing to more strength in the USD. The big question remains as to how far can this go? If we look at the Australian dollar, we have weaker commodities, slowing demand in China and the RBA still on an easing bias so holidays in the US don’t look like they are going to get any cheaper any time soon. The AUDUSD in on course to touch 70 cents this year in my opinion. On the holiday front the only positive is the lower crude oil prices which is benefiting the airlines but doesn’t quite seem to have made its way to the petrol pump for our benefit. Fuel Prices are higher now that when oil was trading around $100/barrel! – explain to me how this works?!

Looking forward I still have a preference for US equities over domestic equities but having said that, we have done quite well locally but better offshore. Stocks such as CSL have pushed to new highs, The banks have been steady and the miners have been hammered. I have been issuing investment recommendations on the ASX200 and we have simply been buying dips in the index. To date we are doing well with this strategy as you can see in the Performance Report on the Performance Page. Timing has been everything but my core view remains that we should perform better in the second half of the year as compared to the first half. With regard to the US we have also been on the right side of the currency move so not only has it been a case of calling the direction of the equity markets but the currency gains have also improved the returns.

From here, I continue to favour health care, technology, pharmaceuticals, biotechnology, banks and solid trending stocks which continue to deliver. The most notable example being Walt Disney in the US up until the overnight movements. Stock down circa 10%.

I will look to put a note out, post the close of each month with an update. Please use this as an opportunity to ask any questions you might have.

LP

Trending Tactics – Trading made simple.

Trending Tactics with Pilkington Trading has a fresh new look. Please press the link below to see yesterday’s report that has the current trends and our entry points/stop losses on each product.

Trending Tactics 6.5.15

Trade all of the products in the report from anywhere, at any time with one low commission account.

Receive daily information on new buy/sell signals and where to move your stop-loss in relation to your current positions.

Trending Tactics looks to take the guesswork out of currency, commodity and index trading. Markets can be fast moving and unpredictable, but once they start a trend it can last a long time. This strategy consists of being long or short the instrument at all times with a stop and reversal order in place that moves constantly to limit risk and increase returns.

Since this strategy has been developed (1999), there have been staggering results as you can see from the far right column:

ScreenShot070

Follow the link to find out more:

http://pilkingtontrading.com.au/trending-fx/

Please register your interest through the Contact Page if you would like to follow this simple, effective strategy.

Covered Call List – May 2015

Please click the link below to see the Covered Call Spreadsheet that illustrates the premium received on a Covered Call (Buy Write) strategy based on the last traded floor prices for all Dow Jones stocks. Also illustrated, is the return generated if the Covered Call is exercised upon expiry.

Covered Calls – May 2015

Performance (ROI):

  • 11.52% (YTD, Annualised)
  • 19.42% (2014 Calendar Year)


Covered Call (Buy Write) Strategy:

A Covered Call otherwise known as a Buy Write is when an investor purchases a parcel of stock and then sells a corresponding call on that stock so as to receive premium or cash for doing so. This strategy is very good at providing an additional monthly income stream for shareholders and somewhat protecting against a fall in share price.

One option gives exposure to 100 shares in the Australian market and 100 shares in the US market. (Can be adjusted occasionally due to Corporate Actions)


As an example:

A client purchases 100 shares of XYZ Corp for 50.00 on the NYSE. The client then sells a $51.00 call expiring one month from now @ $0.45 and receives $45.00USD ($0.35 x 100) in cash premium.

The investors upside is now capped at $145.00USD at expiry:

(Strike price ($51.00) – Stock purchase price ($50.00) + Premium Received ($0.45)) x 100

This equation is the premium received for writing the call, plus the potential capital gains from the stock holding up to the sold call strike.

The investors downside risk is that the stock can fall to $0.00 which would incur a loss of 49.65USD (Cost of Stock ($50.00) – Premium Received ($0.45)). The likelihood of this occurring is extremely slim as the investment will be made in strong, proven companies such as those in the Dow Jones or ASX20.


Calculations:

The Monthly Premium Received (%) is the option premium received divided by the purchase price of the stock (stock price).

Monthly Return if Exercised (%) is calculated by:

(Strike Price – Stock Price) + Option Premium =  X

X/Stock Price = Monthly Return if Exercised (%)

1 Covered Call = 1 Sold call option and 100 bought units of stock.


If you have any questions regarding this strategy, please contact me or request a call.

LP
The week ahead 20/4/2015

S&P 500

  • US equities experienced a sharp rejection of recent highs as news that China was increasing the scope for short selling of domestic stocks and curbing margin trading triggered a wave of profit taking across the globe.
  • This was followed by a 100bp cut to the Reserve Requirement Ratio to 18.5% for all banks on Saturday to help stem the impact of an economic slowdown. This is the largest single cut in the RRR since the GFC.
  • The sudden drop in the S&P 500 brings the index back into the wider trading range that has dominated the index for much of the past 6 months, As we have been noting in this report we anticipate that this will largely continue as US equities underperform on the back of a Fed looking to increase interest rates, a stronger US dollar and a slowdown in corporate earnings.
  • US equities will be choppy and the underlying long-term upward bias will constitute a very slow grind.
  • Support across 2038 still remains crucial with any technical downside break occurring will at the very least trigger additional weakness to 1980/1973. Risks of an overshoot to 1950 also need to be considered in such an event.
  • We see the next key data point on giving guidance to when the Fed raises rates being the next employment data on May 8. A strong number here could raise the risks of a June or July hike. Furthermore, the next major loan payment for Greece is due mid-May so as uncertainty approaches in May the traditional “sell in May and go away” could be a wise approach this year.
  • The varying performance of individual sectors is reflective of late stage bull markets where volatility increases and divergence begins to expand between sectors. Such circumstances though can still persist for over 12 months before the key major indices make their ultimate peak.

ScreenShot001

ASX 200

  • The ASX 200’s third attempt at breaking through 6000 has failed contrary to our expectation and without a rate cut in May, a move beyond that level is now looking increasing unlikely until well into the second half of the year, at the earliest.
  • This third failure is quickly resembling the price action seen in the middle part of 2014 where the ASX 200 experienced choppy and whippy price action with attempts to make new highs failing to gain any momentum.
  • The market reaction late last week has also to begin to unwind some of the optimism around high dividend yielding stocks with property trusts and banks particularly weak on Friday. While we still see this pullback as ultimately presenting a buying opportunity, the erratic nature of this market and divergence in performance between stocks on a daily basis and even within the same industry, means predicting where a low will come is difficult to do with any certainty.
  • In such circumstances it is wise to move to higher holdings in cash and await technical setups and clarity of global developments (Greece, RBA rate cuts, China slowdown and rate cuts, US earnings, Fed rate hike), before deploying capital aggressively.
  • Stock selection should now turn to be on a case by case basis as the basis behind a broader market rally is dissipating without the emergence of a sharp recovery this week.
  • Last week we were encouraged by the ASX 200’s ability to hold above its moving average supports in the 5924/5882 zone, but as of Friday these have now been convincingly breached adding to our short-term concerns being raised.
  • The negative case in our view at this point is the risk of the ASX 200 retreating back to the major support zone of 5750/5700 with moves under here only in the event of the RBA failing to cut rates in May once again.

ScreenShot002

Our Eyes Are On the Following….

ScreenShot058

Most of my focus at the moment is offshore, predominantly in the US as we are seeing a strengthening USD and a falling AUD, meaning that when we close trades in USD, our profits in AUD are even greater. In the last six months alone, if you were to hold your cash in USD rather than in AUD in your Australian bank account, you would have returned approximately 17% alone as the Aussie Dollar has fallen away.

In terms of US names we are predominantly invested in the following companies:

Apple Inc. (AAPL) – Target price $137.00.

Citigroup (C) – Target price $73.00.

Rackspace (RAX) – Target price $55.00.

Monster Beverage Corp. (MNST) – Target price $136.00.

Another huge focus of my client’s portfolio’s is getting exposure to the WTI Light Crude Oil price through United States Oil Fund (USO) and PowerShares DB Oil fund (DBO) Exchange Traded Funds. I am expecting to see a bounce in the oil price in the next calendar year and looking to take advantage of this through these funds.

On the local front the names I have in mind at the moment are all yield plays essentially:

Most of the banks.

Telstra (TLS)

Wesfarmers (WES)

Woolworths (WOW)

Flight Centre (FLT)

Woodside Petroleum (WPL) – again, to get exposure to the oil price on an expected rebound.

I think overall, the markets are due for a slight correction before looking to move higher throughout the latter half of the year. Feel free to contact me for any research on the above stocks and what I am basing my thoughts on.

LP

Market Update – 11th September 2014

ScreenShot187

Below is a brief rundown of the currency and equity markets and Pilkington Trading’s views.

Currency markets.

Strong USD to remain

Europe and in particular Germany is showing some real signs of weakness and if ECB goes down the QE path it could be a prolonged period of weakness for the Euro.

Scottish referendum weighing in on the GBP along with the weakness across Europe. Volatility is back to more normal levels above 10%.

AUD and NZD are being hurt by weaker commodity prices and a prolonged outlook for lower interest rates on home soil.

EURCHF – Concern is growing that the peg at 1.2000 will give way which will create a lot more volatility if that is the case.

The FOMC meeting next week could really paint a picture for a stronger USD so possibly more weakness in the AUD.

The ECB is not meeting until Oct 2nd


Equity Markets

All eyes on Alibaba’s public listing next week with talk it will come in at between $60-$66 per share for a value of about $20+ billion.

AAPL is back in the news with its new product launches this week. First day of the announcement saw a volatile stock price ranging from $96.14 to $103.08 before looking to close only $0.37 below the previous close. After digesting the news and the company releasing its new products including the iPhone 6, iPhone 6+ and Apple Watch, investors liked what they saw and the stock saw a good bounce closing up 3.07% at $101.00. A move higher from here looks likely in our opinion.

Dow still remains the weakest of the 3 major indices in the US posting the smallest gains with +3% as opposed to +8% for the S&P500 and +9.8% for the Nasdaq YTD.  We are still firm believers that the technology trend will continue and favour exposures to the stocks listed on the Nasdaq Exchange.

Seasonal Trade Ideas – June to October.

In relation to my seasonality posts that I have posted earlier in the year, below is a link to the June – October seasonality of Australian stocks that BBY believes could have some upside potential through this period.

Please click the link below to view the comprehensive report.

Trade Ideas – June through to October 2014

Feel free to contact me with any queries or questions in regards to this report or how you can invest in any of the stocks.

LP

It’s time to build/begin that portfolio! 20.05.2014

Thought I would pen together a quick email to update you on where the markets are sitting, my views on what I believe will be happening and the stocks I have/looking to gain exposure in.

I believe we are starting to see the top of the market and a small pull back is upon us. The XJO has had two strong negative days and I think we should see the index head toward 5300 over the next month or so. I still believe we will see the markets rally from June onwards and this pull back will be a great opportunity to enter the markets with a view through to the years end and beyond. There is plenty of money sitting on the sidelines with massive fund managers and superannuation providers. There is talk that a shift from bonds (only returning 2.56% on 10 year US Treasury notes ) into the equity markets will bring a whole new wave of buying momentum. I have a target locally of the ASX200 reaching 6000 by the years end.

ScreenShot017


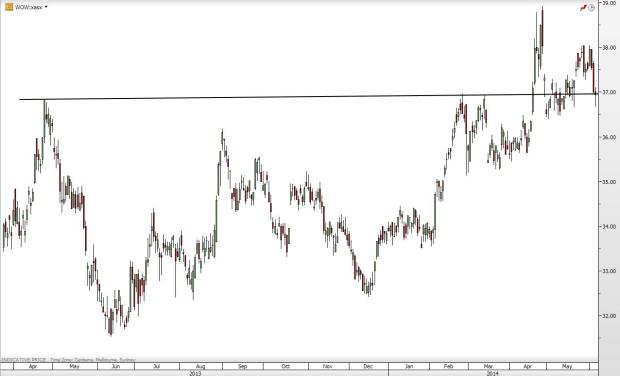
High yielding stocks are paying investors dividends upwards of 5-6% (TLS, WPL, NAB etc.) alone on local soil and some stocks in the US yielding upwards of 8% in strong, well performing companies such as Seadrill Ltd. (10.47%) and High yielding ETFs . I think it is a great time to look into getting into some safe, high yielding stocks that have a good management team behind them and are looking to grow. I especially like the look of Woolworths (WOW.asx) on the local market. The stock has broken the $37.00 level convincingly, come back and is looking to use this level as a support before we see a rally higher from these levels. Coinciding with the 50 day moving average, a key rising trend line and the stock bouncing from the 38.2 Fibonacci retracement, I think we will see a move higher from these levels.

ScreenShot018


These stocks will drive our market higher, return investors with great dividends and have a good chance of seeing capital growth in the medium to long term. It’s a great time to be looking to build on your current portfolio or begin to build one with the support of BBY Limited and myself. With access to the best local stock and sector research, 24/7 trading desk support and execution services, access to daily reports, market wraps and trade ideas, do yourself a favour and find out how we can structure a strategy to suit your investment style and risk appetite.

There are both the online (more do it yourself with access to most features) and full service broking options (complete full service broking option that allows you to build a strong portfolio with a hand to hold) available. For a conservative Covered Call writing or High Yielding option strategy that may suit your SMSF or personal trading goals with a long term outlook please ask as this is an area that is extremely important to remain in control of (Now that we are all going to work until we are 70!).

Please contact me if you are interested in knowing about the stocks both locally and internationally that I have invested in myself and have the majority of my clients gaining exposure in.

Clients, please feel free to ask me any questions you may have.

LP

BBY Sector Review – Australian Retail 03.02.14


images

Click here to see the full report:

BBY Sector Report – Australian Finance.

As was widely reported yesterday and with confirming announcements from the companies today, Myer Holdings (MYR) bid for David Jones (DJS) on October 28. Our thoughts about this are: 1. It was highly opportunistic, Paul Zahra the CEO of DJS announced his resignation on October 21, so the board at that stage were presumably in a state of some disarray. The bid included no premium for DJS shares; 2. The bid is an acknowledgement by MYR its outlook is not great; 3. We think the deal would have a difficult time proceeding from a regulatory prospective, particularly the ACCC; 4. The acquisition would be difficult for DJS and MYR shareholders. Firstly for DJS shareholders, as mentioned no premium was offered. Secondly for MYR shareholders with DJS trading at $2.75 at the time or 1.8 times its book value, it would entail MYR servicing an additional $650M in goodwill. Given synergies of 1/4 of the DJS cost base and a 10% gain on supplier terms, MYR EBIT and NPAT would rise from $215M and $125M respectively to a pro-forma EBIT and NPAT of $440M and $280M in FY13 and EPS from $0.22 to $0.24, but the ROE would fall from 14% to 12%. Not sufficiently inspiring. The above analysis gives the company full value for synergies of $85M in year 1, but the proposal does not allow for these until year three. Also we have not allowed for integration costs.